
Where England’s Primary School Places Are Empty, And Why
Original research · Analysis date 30 July 2026
The original hypothesis was that under-filled schools would mostly be the ones surrounded by rivals. The data say the opposite. Isolation, not competition, produces the highest rate of empty places: 57% of schools with no other primary within two kilometres are below 90% capacity, against 33% of schools with six to ten neighbours. The more company a school keeps, the more likely it is to be full.
That rules out the comfortable conclusions from this research. There is no reading of these numbers in which competition is making English primary schools empty. England has fewer primary-age children than it has primary places, and it is going to have fewer still. The shortage is demographic everywhere, in a Cumbrian village and in London boroughs alike.
What differs is what happens next. A school standing on its own absorbs its share of the local shortfall, and there is very little it can do about that. Where four schools sit within a mile of each other, the same shortfall gets distributed between them by parental choice, and it is not distributed evenly: one is full, and one is a third empty. The birth rate does not explain the difference between those two schools. Something else does.
So both problems are demographic. One of them is also competitive. We have measured how much.
Summary: We analysed Department for Education data for all 11,893 established state-funded mainstream primary schools in England. 42.5% are operating below 90% of their capacity, with 339,214 empty places between them. Isolated schools (those with no other primary within two kilometres) are the worst affected: 57% are under-filled, against 37% of schools with three or more neighbours. But isolated schools are only a fifth of the country, so most of England's empty places sit in populated areas, simply because most schools do. The national shortage is demographic and applies everywhere. What differs is whether a school can do anything about its own position: just over half the empty places in schools that have a neighbour are places that school is missing relative to the area around it, rather than places the area does not have children for.
established state primaries analysed
are below 90% of capacity
empty places between them
a year in per-pupil funding those places represent
Why we did this
Primary pupil numbers in England are falling. The DfE projects a decline of around 5% between 2025 and 2028 (roughly 185,000 children) with further falls after that. London Councils report approximately 90 school closures or mergers in the capital in five years.
The usual explanation is the birth rate. It’s true, and it’s incomplete. It doesn’t explain why, in the same town, one school is full and another two streets away is a third empty.
We wanted to separate the two: how much of England’s empty-place problem is demographic (lower population density, fewer children, nothing to be done in the immediate term) and how much is competitive, where there are children locally, but the school isn’t the one families choose.
What we did
Data
- DfE Get Information About Schools, full establishment extract, 30 July 2026
- Capacity as recorded in that extract. Pupil numbers are from the school census of 15 January 2026, which is the most recent count the extract carries
- Released under the Open Government Licence v3.0
Scope
Open, state-funded, mainstream primary schools in England: 16,669 in total, of which 16,472 had usable capacity and pupil figures.
Exclusions (4,579 schools), and why
Two categories distort this analysis badly:
- Schools opened since September 2018. 3,291 excluded. A new primary opens with a Reception class and fills over about seven years. In occupancy data, it looks catastrophically empty while behaving exactly as designed. This is the single biggest false positive in the dataset.
- Sponsor-led academies. 1,288 excluded (a further 557 were already excluded above as recently opened).
Analysis set: 11,893 established mainstream state primaries, holding 3,226,799 pupils against a capacity of 3,574,146, an overall occupancy of 90.3%.
The competition measure
For each school we counted other state primaries within two kilometres, calculated from Ordnance Survey grid references rather than postcode centroids. Two kilometres approximates a realistic walk or short drive for a primary-age child. The rival count includes new and sponsor-led schools, since they compete for the same families even though they’re excluded from the occupancy analysis.
What we found
1. Two in five established primaries have significant empty space
5,058 schools (42.5%) are below 90% occupancy. Between them they have 339,214 empty places.
TThe median under-filled school has 51 empty places. At the 2026–27 minimum funding rate of £5,115 per primary pupil, that’s about £261,000 a year the school isn’t receiving. Because primary cohorts rarely refill in later year groups, an under-filled Reception class carries its shortfall for up to seven years, or roughly £35,800 per empty place over a child’s primary journey.
Across England, filling every empty place in those schools would move approximately £1.7 billion a year in per-pupil funding. (That figure describes the scale of unused capacity, not money withdrawn from schools. Per-pupil funding follows pupils, so places that were never filled were never funded.)
2. The highest rates of emptiness are in isolated schools
| Other primaries within 2km | Schools | % below 90% | Median occupancy |
|---|---|---|---|
| None | 2,412 | 57.0% | 86.2% |
| 1–2 | 1,511 | 47.3% | 91.0% |
| 3–5 | 2,004 | 40.2% | 93.3% |
| 6–10 | 2,971 | 32.9% | 95.1% |
| 11+ | 2,995 | 39.6% | 93.3% |
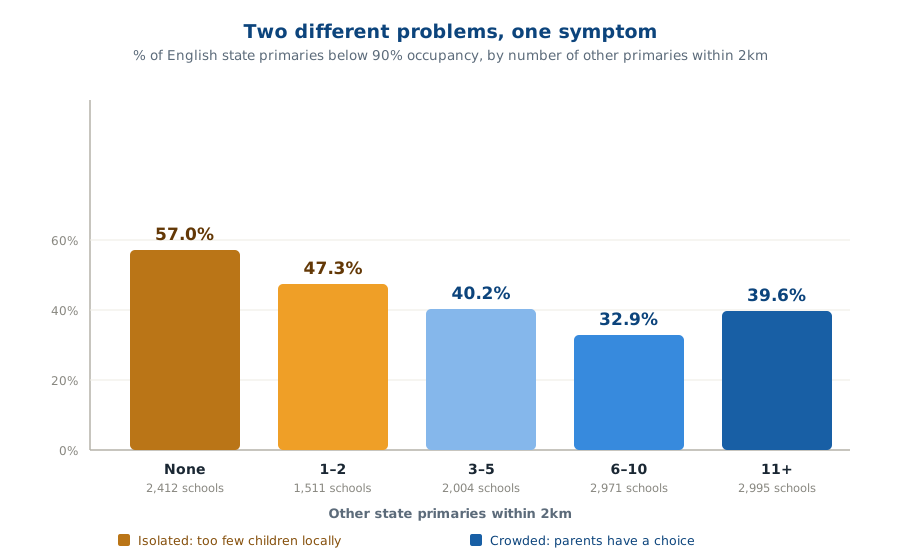
Schools with no neighbouring primary are far more likely to be under-filled than schools with several. That is a demographic story: isolated schools are mostly rural, rural areas have fewer children, and no amount of marketing conjures four-year-olds who don’t exist.
The one break in the pattern is at the crowded end: schools with eleven or more neighbours are under-filled more often (39.6%) than those with six to ten (32.9%). That is the only point in the data where more competition goes with more empty places. The densest areas are overwhelmingly London, which has its own falling child population, so composition may explain the whole of it. We report it because it is there, not because we can account for it.
3. But most empty places are in populated areas, because most schools are
Rates and volumes point in different directions, but we need to be careful about why.
Of the 5,058 under-filled schools:
- 1,376 (27.2%) have no other primary within 2km — 56,416 empty places
- 2,968 (58.7%) have three or more — 242,029 empty places, about 71% of the national total, worth roughly £1.24 billion a year
It would be easy to read that second line as evidence that competition empties schools. It is not, and we want to be explicit about it. 67% of all English primaries have three or more neighbours, so a group holding 59% of the under-filled schools is under-represented, not over-represented. Their under-occupancy rate is 37.2%, below the national 42.5% and well below the 57% for isolated schools. Clustered schools are less likely to be under-filled, not more.
Two things are doing the work in that 71%. Most schools are in populated areas. And urban schools are bigger, so each under-filled one carries more empty places: 81 on average against 41 for an isolated school.
So we measured the thing that actually matters.
Knowing a school has neighbours tells you nothing on its own. What matters is how it compares with them. For every under-filled school we pooled all the other primaries within two kilometres into a single local occupancy rate, and split the school's empty places in two:
- Area — the places that would still be empty if the school exactly matched its neighbourhood's occupancy. The local pool is genuinely short of children.
- Share — the places it is missing relative to the area around it. The children are there; this school is not getting its proportion.
A school already doing better than its neighbourhood scores zero on share. The two sum to that school's empty places, and nationally they sum to 339,214.
| Category | Empty places | Share of total |
|---|---|---|
| Isolated schools — no primary within 2km | 56,416 | 16.6% |
| Area — local pool short of children | 138,472 | 40.8% |
| Share — school below its own neighbourhood | 144,326 | 42.5% |
| Total | 339,214 | 100% |
Of the empty places in schools that have at least one neighbour, 51% are share rather than area, about £0.74 billion a year.
Two kilometres is a judgement call, so we ran it at other radii. Between one and three kilometres the share proportion moves from 52.0% to 50.4%. The answer does not depend on the radius we picked.
The honest counterweight is in the same numbers. Of the 3,681 under-filled schools with a measurable neighbourhood, 59.8% sit in a neighbourhood that is itself below 90% full, and only 18.2% sit in one that is 95% or fuller. Most under-filled schools really are in areas short of children. The point is that within those areas the shortfall lands very unevenly: 79% of these schools are below their own neighbourhood's rate, by a median of 9.3 percentage points.
And it is zero-sum. If every under-filled school closed the gap to its neighbourhood, those pupils would come off the rolls of the schools around them. This measures how much of the problem is distribution rather than scarcity. It does not conjure 144,326 children.
4. London is the extreme case
London has 1,459 established primaries in the analysis, of which 702 (48.1%) are below 90% occupancy, with 78,800 empty places, about £403 million a year, the largest of any region.
London is also the place where the rural explanation obviously cannot apply at all. The median London primary has 17 other primaries within 2km, and virtually none of the capital's schools are isolated, so whatever is emptying London's classrooms, it is not that families have nowhere else to go. (The figure that 99% of London's under-filled schools have three or more rivals is true but says little on its own, since almost every London school does.) London's child population is falling for its own reasons (births, housing costs, families leaving the city) and the capital's schools are absorbing that fall while in constant sight of one another.
5. Where it’s most concentrated
| Region | Schools | % below 90% | Empty places | Annual value |
|---|---|---|---|---|
| South West | 1,270 | 50.6% | 38,710 | £198m |
| London | 1,459 | 48.1% | 78,800 | £403m |
| North East | 535 | 47.7% | 16,647 | £85m |
| East Midlands | 1,147 | 44.6% | 28,023 | £143m |
| Yorkshire and the Humber | 1,195 | 44.0% | 32,342 | £165m |
| East of England | 1,349 | 40.5% | 33,738 | £173m |
| North West | 1,837 | 39.2% | 40,767 | £209m |
| South East | 1,956 | 38.5% | 45,676 | £234m |
| West Midlands | 1,145 | 34.8% | 24,511 | £125m |
| Local authority | Schools | Below 90% | % | Median occupancy |
|---|---|---|---|---|
| Lambeth | 55 | 40 | 72.7% | 81.6% |
| Westminster | 29 | 21 | 72.4% | 76.3% |
| Merton | 39 | 27 | 69.2% | 84.3% |
| Northumberland | 83 | 57 | 68.7% | 77.7% |
| Cumberland | 121 | 81 | 66.9% | 84.5% |
| Wiltshire | 129 | 84 | 65.1% | 82.9% |
| Westmorland and Furness | 102 | 66 | 64.7% | 82.1% |
| Hammersmith and Fulham | 31 | 20 | 64.5% | 85.4% |
| Southwark | 54 | 34 | 63.0% | 82.1% |
| North Yorkshire | 204 | 128 | 62.7% | 84.7% |
The list is a near-perfect illustration of the two problems side by side: dense inner-London boroughs where families have many options, and large rural authorities where they have almost none.
What the data cannot tell you
- Occupancy is not quality. A school can be excellent and under-filled. In our experience, that’s the most common case of all.
- Capacity figures are administrative. Net capacity and admission numbers are set locally and don’t always match what a school considers full.
- This is a single snapshot. In-year mobility, particularly in cities, continuously reshapes numbers.
- Proximity is not catchment. Two kilometres is a proxy. Real catchments are shaped by roads, rivers, railways, faith criteria and admissions rules we haven’t modelled.
- We cannot see cause. The data shows where empty places are and what those schools have in common. It cannot say why any individual family chose one school over another.
- The share figure is a comparison, not a forecast. TIt measures how far a school sits below the area around it. It does not follow that every school could close that gap, and if they all did the pupils would come from each other. Nationally the number of children is what it is.
- Faith and nursery provision made little difference to under-occupancy rates in this analysis (44.9% of faith schools below 90% against 41.2% of non-faith; nursery provision showed no meaningful effect), so we’ve not drawn conclusions from either.
Why this matters
Every school in this analysis is dealing with the same national fact: there are fewer children than there are places, and no school can change that. Anyone selling a primary school a way to raise the birth rate is selling something.
But if your school stands alone, that national fact arrives as your whole story, and the realistic responses are federation, a lower admission number, or a conversation with your local authority. Marketing will not move it, and we would tell you so.
If your school has others within a mile (which is the case for three-quarters of England's under-filled primaries) the national shortfall reaches you through a local distribution, and that distribution is not fixed. Just over half of the empty places in schools like yours are places they are missing relative to their own area, not places the area has no children for. Sometimes that's reputation. Very often, in our experience, it's simply that local parents don't know the school exists, have never been inside it, and have no particular reason to look.
That is a solvable problem, and a cheap one relative to what an empty class costs. The system we use to fix it is the same one we’ve run for schools since 2018.
We published a full account of one such case in 2019, a one-form-entry primary in Lambeth, which this analysis now identifies as the most under-filled local authority in England. The school went from 22 children joining Reception to a full class and 97 applications, on just over £1,000 of advertising. Detailed in the full Case Study here.
Everything we know about fixing a falling-roll problem that is not a result of demographics is set out in 18 articles in the advice section of this site.
The two situations look identical on a spreadsheet (an empty class is an empty class) and telling them apart matters more than anything else you do next. If you would like us to review your school and tell you which one you have, the Marketing Health Check takes 15 minutes, and we will give you a straight answer either way.
Get the data
The aggregate analysis is free to use with attribution. Journalists, local authorities and researchers are welcome to regional and local-authority breakdowns, email [email protected].
We do not publish and will not share a list of named under-filled schools. Every figure here is aggregated to region or local authority. School-level data is public, but assembling it into a league table of struggling schools helps nobody and would damage the schools we exist to help.
Two graphics, free to reproduce
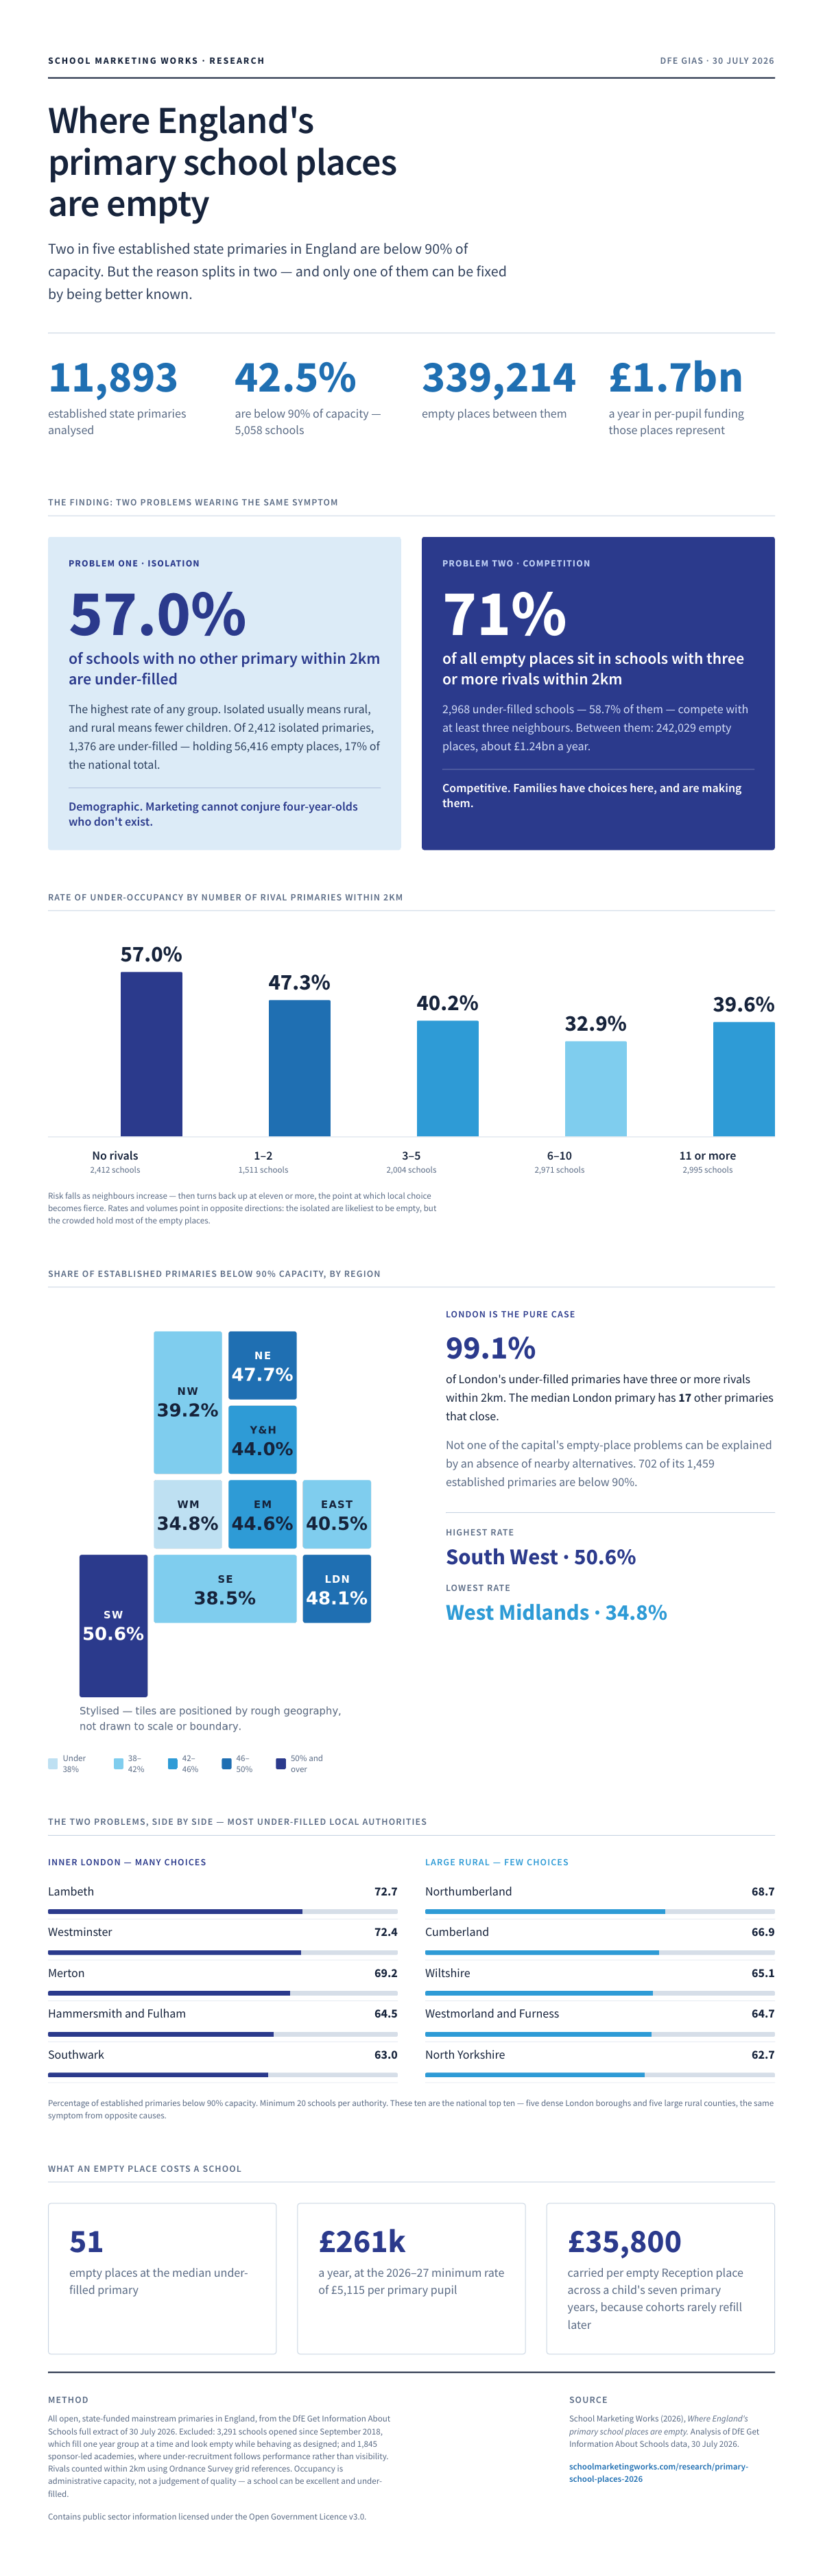
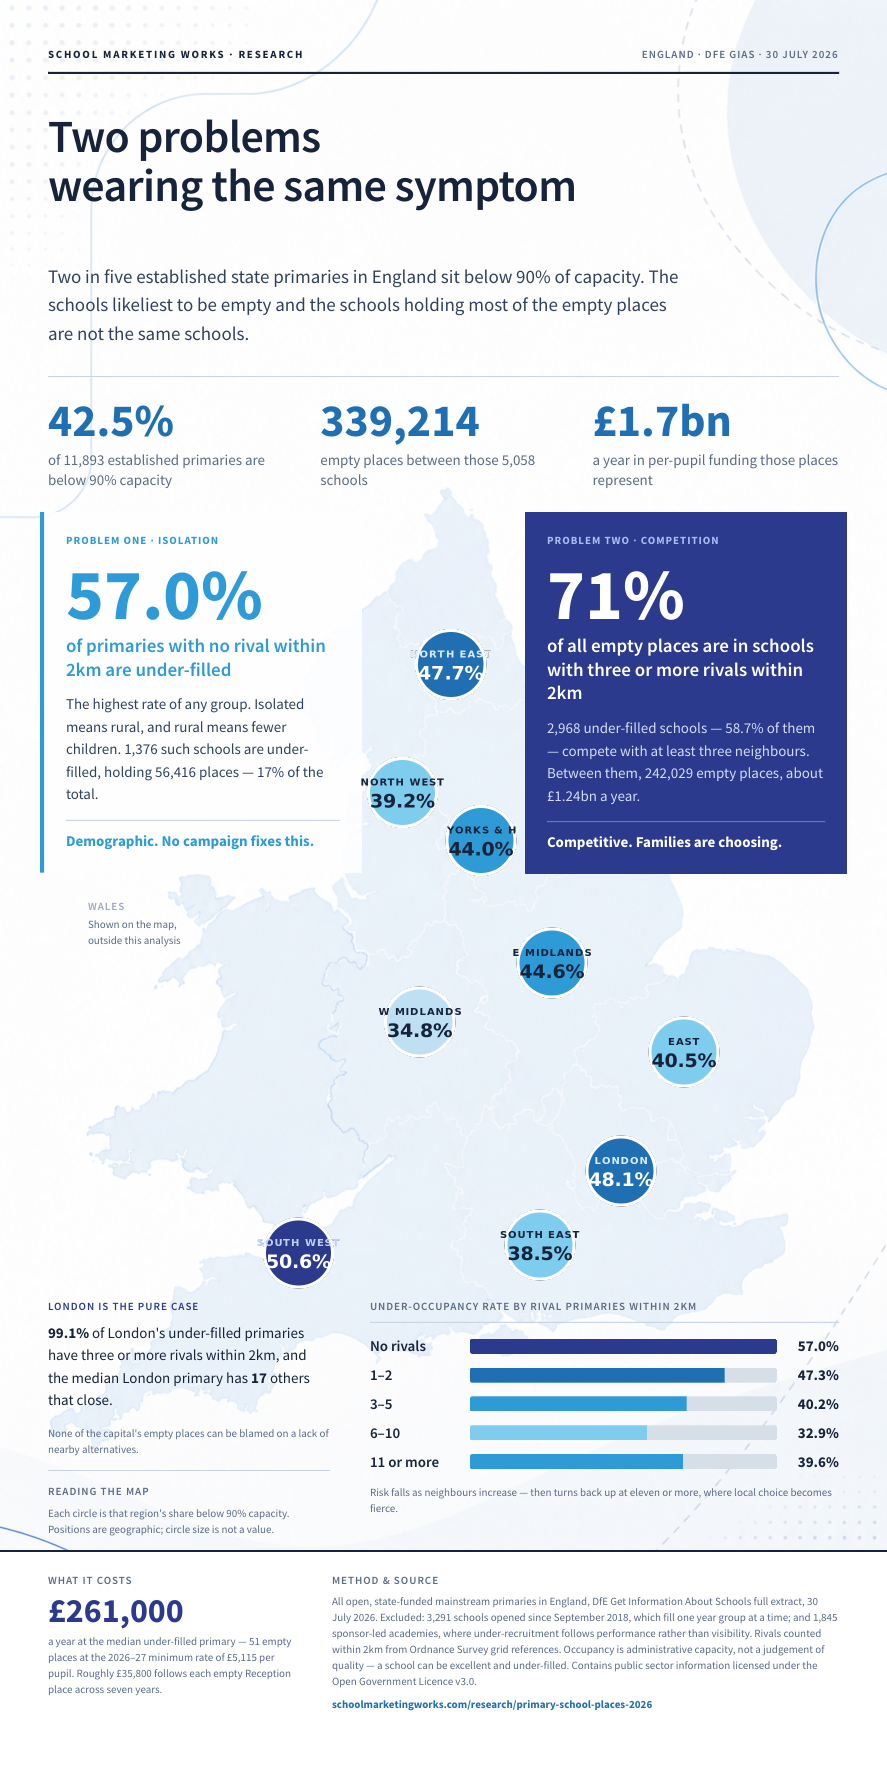
Both are yours to publish, print or post, without asking us first. Take the PNG for web and social, or the PDF if it is going into print. Please credit School Marketing Works and link back to this page. If you need a different crop, a transparent version or the underlying figures behind either one, ask and we’ll send them.

Every headline number, the rate-versus-volume split and the regional picture, laid out to be read. The better one if you are running the story itself.

The same two problems shown across England, region by region. The better one for social, a newsletter, or anywhere it will be seen small.
Sources
Frequently asked questions
How many primary schools in England have empty places?
Of 11,893 established state-funded mainstream primaries in England, 5,058 (42.5%) are operating below 90% of capacity, with 339,214 empty places between them. (The analysis excludes schools opened since September 2018, which are still filling year by year, and sponsor-led academies.)
How much funding does a school lose from empty places?
Each place is worth at least £5,115 a year at the 2026–27 minimum per-pupil rate. The median under-filled primary has 51 empty places, about £261,000 a year. Because primary cohorts rarely refill in later year groups, each empty Reception place carries a shortfall of roughly £35,800 across a child’s seven years.
Why are primary schools losing pupils?
Fundamentally because there are fewer primary-age children than there are primary places, and the DfE expects around 185,000 fewer children by 2028. That shortage reaches schools in two different ways. Isolated schools (no other primary within 2km) take it directly, and have the highest rate of under-occupancy at 57%. Schools with neighbours take a share of it, and just over half of their empty places are places they are missing relative to their own local area rather than places the area has no children for.
Which parts of England have the most empty primary places?
By rate, the South West (50.6% of schools below 90%) and London (48.1%). By local authority, Lambeth is highest at 72.7%, followed by Westminster (72.4%) and Merton (69.2%). In volume terms, London has the most empty places, 90,165, worth about £461 million a year.
Can school marketing fix a falling roll?
It cannot create children, and nationally the shortage is demographic. What it can affect is a school's share of the children who are there. Where a school stands alone there is no share to change and marketing does little. Where a school has several primaries within walking distance, about half its empty places are ones it is missing relative to the area around it. That is the half where visibility, reputation and how easy it is to arrange a visit make the difference.
How much of the empty-places problem could actually be fixed?
Of England's 339,214 empty primary places, 16.6% are in schools with no other primary within 2km, where there is realistically nothing to be done locally. Of the remainder, we estimate 51% are places a school is missing relative to the area around it, and 49% are places the local area has no children for. The first figure is not a pot of recoverable pupils (it is zero-sum between neighbouring schools) but it does say that for an individual school, roughly half its shortfall is about its position locally rather than the birth rate.
Which of the two problems does your school have?
They look identical on a spreadsheet. The Marketing Health Check takes fifteen minutes and we will give you a straight answer either way.
Take the Health Check